Business Insights tool
Bandwidth is a leading cloud communications platform that provides APIs for voice, messaging, and emergency services. Enterprises, SaaS companies, and telecom providers use Bandwidth to integrate scalable communication solutions into their products.
This analytics tool offers real-time insights into voice and messaging usage, helping businesses track performance, optimize costs, and ensure compliance.
Project type: end-to-end
Duration: 5 months
Project role: UX research and design

Understanding our users
Workshopping
As my company began making efforts to enter new markets it became increasingly important to understand who our users were and how they were using our services.
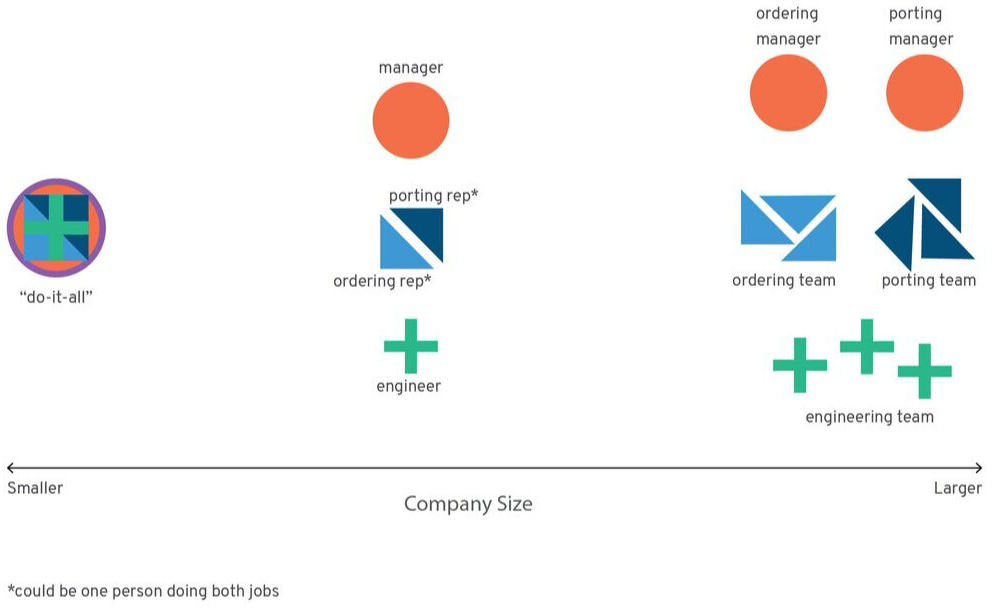
After some initial discovery with our customer facing teams, we were able to determine our five key types of users, which translated into our personas, and how their organizations were structured at various company sizes.

What we learned
In our average sized customer‘s company, there was generally:
A manager who oversaw porting and ordering representatives
Porting and ordering may be done by different people, or by one person filling both roles.
As companies get larger, they usually had entire teams of porting and ordering reps.
On the flip side, in smaller companies, one user may be wearing the hat of each persona.

Our target personas
This was a fun challenge because the data presented would be used very differently by two of our user personas. The manager persona was looking for user-specific, high level data that would help her to evaluate her team‘s performance, while the porting agent persona wanted in-depth, readily available data that could equip them with accurate information their end-users were asking for.

Journey mapping
To take our persona development a step further, I created journey maps to link persona insights to other information I had about our users behavior.
My company had been using a feedback service to allow users to submit feedback directly from our applications, and we had 3 years worth of qualitative data that was waiting to be analyzed. This information provided a great list of feature requests and UI suggestions that translated into the opportunities row in my journey maps.
I combined this with information from our customer sentiment surveys to provide as extensive a list as possible.

Data visualization
In order to cater to our customer’s needs and stay competitive in the market, it was vital that our company provide analytics to our customers in a way that was easily digestible and visually appealing.
I partnered with a product owner for the duration of this project. For over 2 years we worked with customers to better understand the core of what they were trying to do better, and how our data could help them to accomplish it.
We began by working with the internal data available to us, and with the help of a data visualization expert, we began crafting countless iterations of prototypes to take to our users.

User testing
A/B Testing
After each test was completed, I published a report summarizing our design directions, testing goals, and user‘s pain points and feedback.
Data-backed design validation was particularly important for this project because there were a large number of stakeholders that wanted to be involved. Walking them through our process and arming them with the right data helped everyone feel comfortable with the decisions made.

Final designs
